


The body mass index, or BMI, is commonly used to detect overweight or obesity quickly, as it is obtained by dividing weight by the squared height, which requires a simple measuring rod and scale. However, although it is relevant to characterise obesity (except in the case of very muscular athletes), its effectiveness to detect overweight caused by an excess body fat remains debatable in healthy individuals (1).
Indeed, its main limitation is that it is unable to differentiate between muscle mass and fat mass, which can lead to errors in the assessment of subject status. For this reason, it is also relevant to assess body composition in addition to BMI.
In this case study, we will present the cases of two people where BMI is limited in assessing their condition and can therefore lead to errors in management.
Case n°1: Normal body mass index
| Gender | Woman |
| Age | 32 years |
| Height | 163 cm |
| Weight | 55,20 kg |
| BMI | 20,78 kg/m2 |
Dans ce premier cas, nous avons une jeune femme qui possède un IMC normal, laissant penser qu’elle est en bonne santé et présente une composition corporelle normale. Il est donc intéressant de vérifier cette hypothèse en analysant sa composition corporelle.
Quick Analysis
| Theoretical gap | ||
|---|---|---|
| Fat mass | Skeletal muscle mass | Total body water |
| +2.28 kg | -2.20 kg | -0.80 L |
| Phase angle | 4.6° | |
| Impedance ratio | 0.837 | |
| Bone mass index | 0.86 | |
By looking at the quick analysis, we can observe quite rapidly that her body composition does not correspond to someone in good health. Indeed, her body fat is 2.98 kg higher than the health reference, i.e. 24%, suggesting that she is overweight, to which must be added a 2.20 kg lower muscle mass than the health reference, i.e. 11%. A deficit in muscle mass may be caused by dehydration, as 75% of the skeletal muscle mass is water and it accounts for around 40% of body mass. However, she does not appear to be particularly dehydrated, as the water deficit is 800 mL, so she does have a significant muscle protein deficit.
In addition, her bone mass index is 0.86, which means that she has 14% less bone mass than the health reference, suggesting a significant deficit in skeletal mass.
It is interesting to note that, graphically, the BMI is in the ‘very good’ zone, while all three parameters are in the light green and orange zones, suggesting an altered body composition.
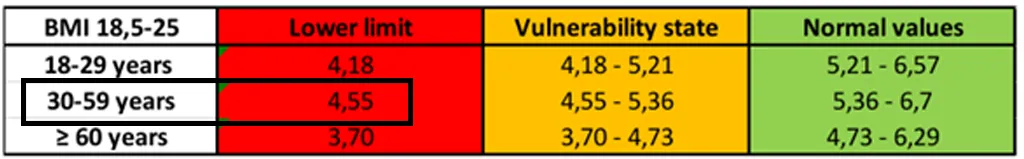
Considering this woman’s age and BMI, we can see that her phase angle is just above the lower limit of 4.55°, suggesting that she is not in good health. This observation is confirmed by the value of the impedance ratio, which is above the threshold value of 0.82, indicating that this patient has a high level of inflammation.
Skeletal muscle mass and body fat mass
| Fat mass at constant hydration | Skeletal muscle mass |
|---|---|
|
Calculated value 27.43 % |
18.50 kg |
|
Estimated reference 22.43 % |
20.70 kg |
|
Theoretical gap +2.98 kg |
-2.20 kg |
If we look more specifically at muscle mass, the theoretical gap with the estimated reference puts this woman’s value close to the orange zone, i.e. in the zone where it could become harmful to health over time. However, it is possible to hypothesise, given her weight, that her muscle mass may not necessarily lead to functional limitations in everyday life. In fact, insufficient muscle mass is responsible for a lower capacity to produce strength and consequently an increase in the physical load involved in everyday activities (climbing stairs, carrying groceries, etc). Ultimately, this increases physical perceived fatigue, leading to a reduction in spontaneous physical activity2.
This hypothesis is quickly refuted by the fat-free mass over weight ratio of 46.44%, which is far from the normal value in women of 48%, meaning that her muscle mass is insufficient for her weight, and that this may be a limiting factor in the ability to carry out activities of daily living.
For body fat, the extra 2.98 kg corresponds to a body fat percentage of 27.83%, which means that she is overweight, when combined with the high level of inflammation, could induce significant risks to her health particularly the metabolic health. Indeed, the combination of these two events is the cause of numerous clinical complications, including insulin resistance, which is the cause of type 2 diabetes, and cardiovascular complications such as hypertension and stroke3.
Bone mineral content and dry fat-free mass
| Bone mineral content | Dry fat-free mass | |
|---|---|---|
| Calculated value | 1.84 kg | 11.23 kg |
| Estimated reference | 2.15 kg | 12.04 kg |
| Theoretical gap | -0.31 kg | -0.82 kg |
| Bone mineral content | Dry fat-free mass | |
|---|---|---|
| Calculated value | 1.84 kg | 11.23 kg |
| Estimated reference | 29.20 L | 42.00%/58.00% |
| Theoretical gap | -0.59 L | 0.33% |
| Gender | Man |
| Age | 30 years |
| Height | 176 cm |
| Weight | 82 kg |
| BMI | 26,47 kg/m2 |
In this second example, we have a 30 years-old young man weighing 82 kg for 1.76 m, resulting in a BMI of 26.47 kg/m², which makes him overweight and, consequently, he could be advised during a medical consultation to lose weight and particularly body fat. However, as before, it is necessary to monitor his body composition before jumping to conclusion.
Quick Analysis
| Theoretical gap | ||
|---|---|---|
| Fat mass | Skeletal muscle mass | Total body water |
| -0.34 kg | +4.52 kg | +0.21 L |
| Phase angle | 7.0° | |
| Impedance ratio | 0.756 | |
| Bone mass index | 1.17 | |

Firstly, the quick analysis showed that this man’s excess weight was not related to fat mass but to a higher muscle mass. Indeed, he has 300 grams less body fat and 4.52 kg more muscle mass than the health references. In addition, his hydration status was good, with a slight total water surplus of 200ml. Finally, the bone mass index showed a bone mineral content that was 17% higher than the health reference.
Taken together, these data suggest a good body composition and health status, and, unlike the previous case, we can see that these compartments are in the green or blue zones, while the BMI is the only one to be in the orange zone. Taken together, these data also suggest that this man is athletic
.
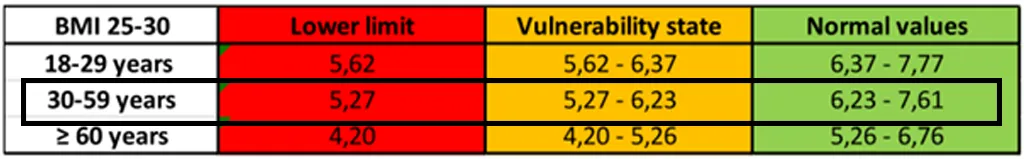
Additionally, we can see that his phase angle is within normal values, which is also true for the impedance ratio, highlighting that his state of health is good, which is in line with his body composition.
Skeletal muscle mass and body fat mass
| Fat mass at constant hydration | Skeletal muscle mass | |
|---|---|---|
| Calculated value | 16.82 % | 34.69 kg |
| Estimated reference | 17.19 % | 30.17 kg |
| Theoretical gap | -0.34 kg | +4.52 kg |
| Bone mineral content | Dry fat-free mass | |
|---|---|---|
| Calculated value | 2.96 kg | 18.19 kg |
| Estimated reference | 2.53 kg | 17.44 kg |
| Theoretical gap | +0.43 kg | +0.75 kg |
| Total body water | Water balance (ECW/ICW) | |
|---|---|---|
| Calculated value | 50.06 L | 39.74%/60.26% |
| Estimated reference | 50.03 L | 40.00%/60.00% |
| Theoretical gap | 0.03 L | 0.26% |