(The original language of this article is French, and the graphs are shown from actual screenshots in the original language)
Skeletal muscle is the organ responsible for locomotion and the ability of individuals to perform daily activities, known as functional capacity. Therefore, muscle dysfunction primarily results in a decrease in functional capacity, the development of comorbidities, and a decline in quality of life.
Muscle dysfunction is characterized by a decrease in muscle mass, its ability to produce strength, and its endurance, these three events defining sarcopenia. The latter is a condition that naturally develops with aging but is also present in a large number of chronic conditions, actively contributing to their pathophysiology.
The diagnosis of sarcopenia is performed through functional measures (strength test, gait speed test, etc.), to detect a decrease in muscle function, and by measuring muscle mass to detect a decrease in it. Reduced muscle mass can be evaluated using the appendicular skeletal muscle mass index (ASMI) based on the lower limits described in the literature. A decrease in muscle mass can also be diagnosed early through an analysis of the loss kinetics over time. Although these two parameters are relevant in the diagnosis of sarcopenia in most chronic conditions, they are much less effective in the context of obesity, which can lead to a lack of diagnosis.
In this case study, we will present a case of sarcopenic obesity by explaining the different markers that allow the initial diagnosis of sarcopenia. This patient was recruited during a study conducted by the National Institute of Medical Sciences and Nutrition Salvador Zubirán in Mexico.
| Sex | Female |
| Age | 49 years |
| Height | 146 cm |
| Weight | 78.80 kg. |
| BMI | 36.97 kg/m2 |
| Pathologies | Obesity |
Quick Analysis
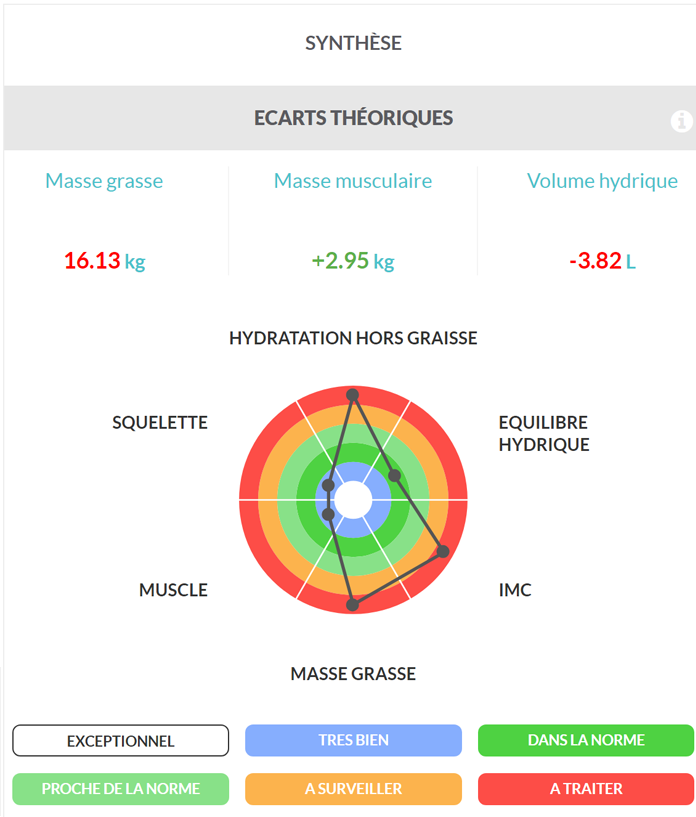
First, we can analyze the synthesis of the data obtained by the Biody XpertZM presented in this figure. As expected, this patient’s fat mass is much higher (+16.13 kg) than her reference, resulting in a BMI of 37, corresponding to class II obesity. This patient’s skeletal muscle mass and bone mineral content are also higher than her reference, which is normal in an obese population, as we will detail later in this case study.
This patient is also very dehydrated (-3.82 L) despite maintaining water balance between the intra- and extracellular compartments. This dehydration has already been described in obese populations, which could be caused by a decrease in total water intake and also the quality of water intake.
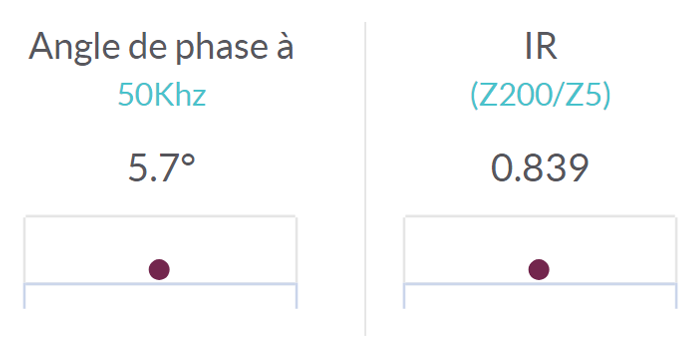
When focusing on the phase angle, we can observe that it is relatively high and could be considered normal as it is comparable to the values obtained in women with a normal BMI (1,2). However, given that the phase angle is strongly related to total cell mass, it is possible that this phase angle value is high partly due to this patient’s high cell mass, which may not necessarily reflect maintained cell quality. This hypothesis is reinforced by the impedance ratio value which is above 0.78, the normal value for a woman (3), and whose value of 0.83 confirms an altered cell quality in this patient, which would be associated with a chronic inflammatory state.
Fat Mass
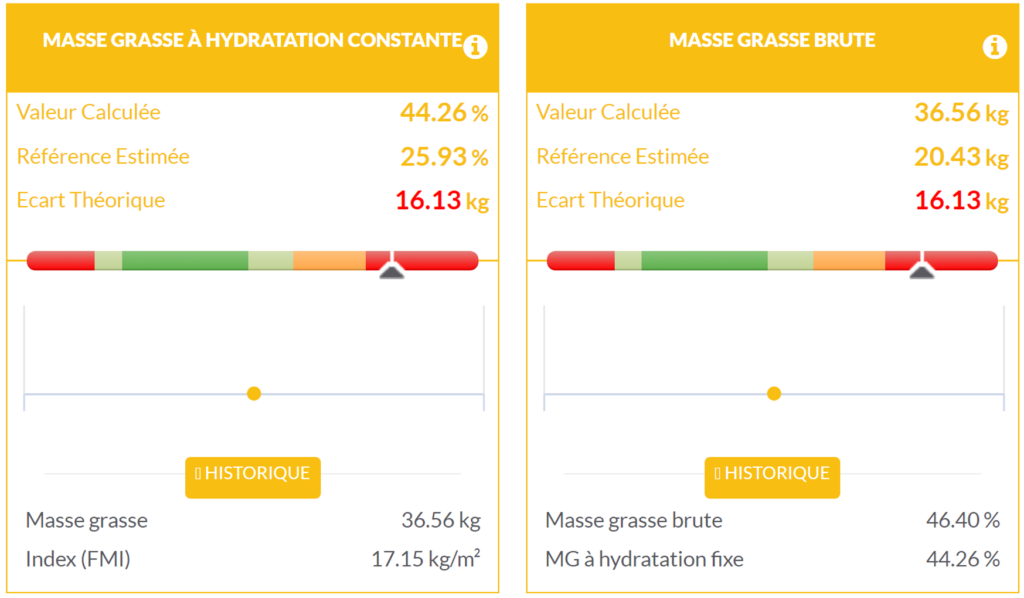
The patient has a gross fat mass of 36.56 kg, which is 16.13 kg of additional fat mass compared to her reference, a fat mass percentage of 46.40%, and a fat mass percentage at constant hydration, i.e., normalized by her weight at perfect hydration, of 44.26%. These figures clearly confirm the significant obesity of this patient.
Skeletal Muscle Mass
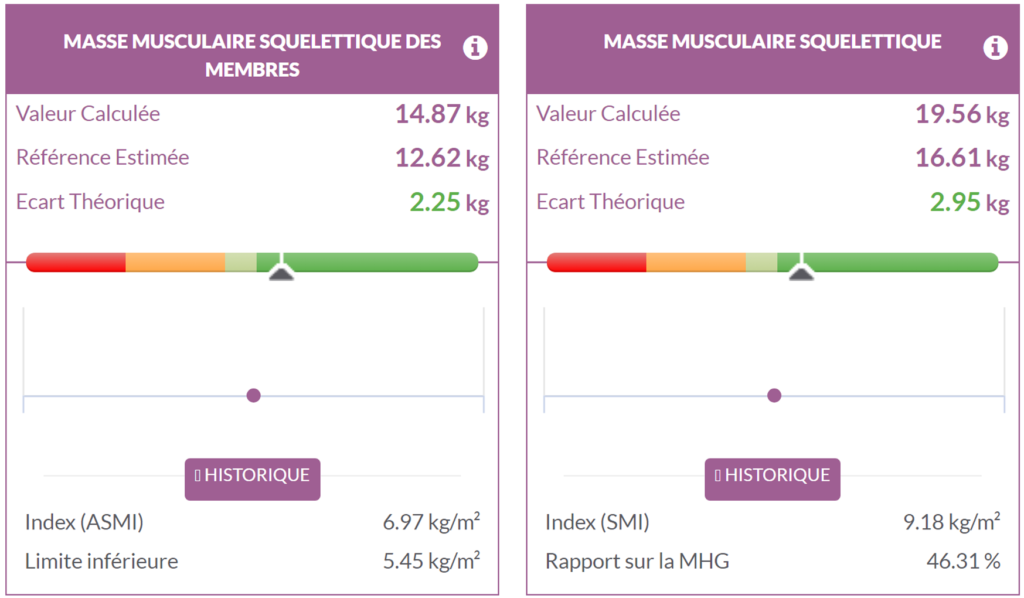
The appendicular skeletal muscle mass index (ASMI) is a recommended parameter for the detection of sarcopenia, with a lower limit set at 7.26 kg/m² for men and 5.45 kg/m² for women (4). Here, the appendicular skeletal muscle mass is 2.25 kg higher than the reference, resulting in an ASMI of 6.97 kg/m². Additionally, the total skeletal muscle mass is also 2.95 kg higher than her reference. Based on these indicators, there would be no sarcopenia in this patient.
This increase in muscle mass may seem surprising given the patient’s extremely low level of physical activity, but this situation is common among obese patients. In fact, the extremely high fat mass increases the mechanical stress on the entire musculoskeletal system, whose main roles are locomotion and maintaining posture. Skeletal muscle can perform these functions thanks to its ability to produce mechanical force, which is closely related to the mass of skeletal muscle. Functionally, skeletal muscle resists mechanical stress by producing enough force to avoid excessive tension on the skeletal muscle membrane. Therefore, an increase in stress on the muscle membrane means that the force produced by the muscle is insufficient. Physiologically, this activates muscle protein synthesis to increase its mass and thus its strength, and in the context of obesity, this normal physiological mechanism is responsible for the high muscle mass in these subjects.
If we associate the diagnostic limits of sarcopenia, the mechanisms, and the results of this patient, it is legitimate to consider that this patient does not have sarcopenic obesity. However, this reasoning overlooks one of the main pathological consequences of sarcopenia: skeletal muscle no longer has sufficient mass and thus sufficient force production to perform its locomotion function. In the context of obesity, it is therefore crucial to ask the following question: is the skeletal muscle mass of patients sufficient to support their body mass?
To answer this question, the ratio of skeletal muscle mass to fat-free mass (SMM/FFM) can be used in the detection of sarcopenic obesity. In this patient’s case, this ratio is 46.31% and is significantly lower than the normal values observed in women, which are 49-50%. Physiologically, this means that her skeletal muscle mass is insufficient to support her body mass. This hypothesis can be confirmed by calculating the ratios of SMM and ASMM to total mass (5), as recommended by ESPEN and ESAO, two European scientific societies. Here, the ratio of SMM to total mass is 24.8%, and the ratio of ASMM to total mass is 18.8%, which confirms the presence of class I sarcopenia in this patient (5).
Metabolic Protein Mass, Fat-Free Dry Mass, and Active Cellular Mass
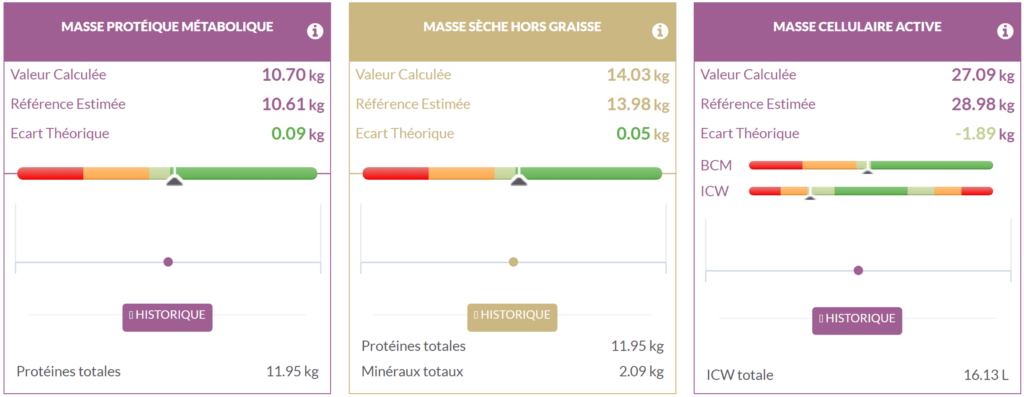
These three parameters can be used to confirm the presence of sarcopenic obesity as their changes over time are closely related to the amount of proteins in the human body, particularly skeletal muscle. Indeed, metabolic protein mass represents the total amount of proteins contained in cells, while fat-free dry mass represents the total proteins and minerals in the body. We can observe that the metabolic protein mass and fat-free dry mass are very close to the reference for this patient. Additionally, active cellular mass shows a deficit of 1.89 kg compared to the reference, with cellular mass (BCM) at the reference level and intracellular dehydration.
Thus, this means that this patient has a total protein mass similar to her reference, which corresponds to a normal BMI. This would indicate that this patient has a muscle protein mass identical to that of a person with a normal BMI, which confirms that her skeletal muscle mass is insufficient in relation to her body mass.
Bone Mineral Content

As with skeletal muscle mass, we can observe a slightly higher bone mineral content than the reference, suggesting adequate bone mass in this patient. However, it is still necessary to question whether this bone mass is sufficient to support the total body mass. In this case, the bone mineral content is very close to its reference, indicating that this patient has a bone mass similar to that of a person with a normal BMI. Just as with skeletal muscle mass, this patient does not have sufficient bone mass to support her entire body mass.
Hydration

In terms of hydration, we can observe a deficit of 2.76 L of water in the entire body and a deficit of 3.82 L in the fat-free mass, showing significant dehydration in this patient, as has already been shown in obesity⁶. This dehydration is related both to a decrease in total water intake and to the quality of the intake, whether liquid or from food. It is also related to increased consumption of sugary drinks, which is associated with increased food intake during meals⁷, thus promoting a caloric surplus. Significant dehydration leads to impaired physiological functioning⁸, so it is necessary to maintain a normal hydration level in these patients.
Regarding water balance, we can observe that the total water balance is maintained, but if we focus only on the fat-free mass, we can confirm the previously observed dehydration. We can also note that dehydration is much more pronounced in the extracellular compartment. This difference between total water balance and fat-free water balance can be explained by the distribution of water within the fat mass, where 80% of the water is located in the extracellular compartment. Indeed, most of the extracellular water is found within the fat mass, creating an artificial water balance at the organism level, while the fat-free mass is significantly dehydrated. Thus, it is also necessary to check the fat-free water balance to monitor the distribution of water within the different body tissues.
General Conclusion
The increase in body mass in patients with obesity results in high muscle mass in these patients, but it is sometimes insufficient to fully ensure their locomotion and posture maintenance functions, which defines sarcopenic obesity. In this context, classical indicators are not powerful enough to detect this sarcopenic obesity, so it is necessary to use more specific markers provided by bioimpedance analysis. As shown in this case study, the ratio of skeletal muscle mass to fat-free mass is a relevant indicator for the initial diagnosis of sarcopenic obesity.

