To present the new feature of our devices, we illustrate its use through the case study of a 10-year-old boy, measuring 150 cm and weighing 35.8 kg. Born at term without complications (birth weight: 3,800 g), he presents normal development and up-to-date vaccinations. He reports no personal or family medical history. His lifestyle is balanced, with a varied diet, regular physical activity (soccer three to four times per week), limited screen time, and nine to ten hours of sleep per night. His general condition is good and the family environment is stable.
How to Take Measurements
The measurements were performed in self-measurement mode, in a seated position with integrated electrodes, following the same recommendations as for adults. It is important to note that measurement in a supine position, using cables and adhesive electrodes, also constitutes a validated and reliable option. The obtained values were transferred via Bluetooth directly to the BiodyManager.com software, on the previously created profile.
The Color Synthesis
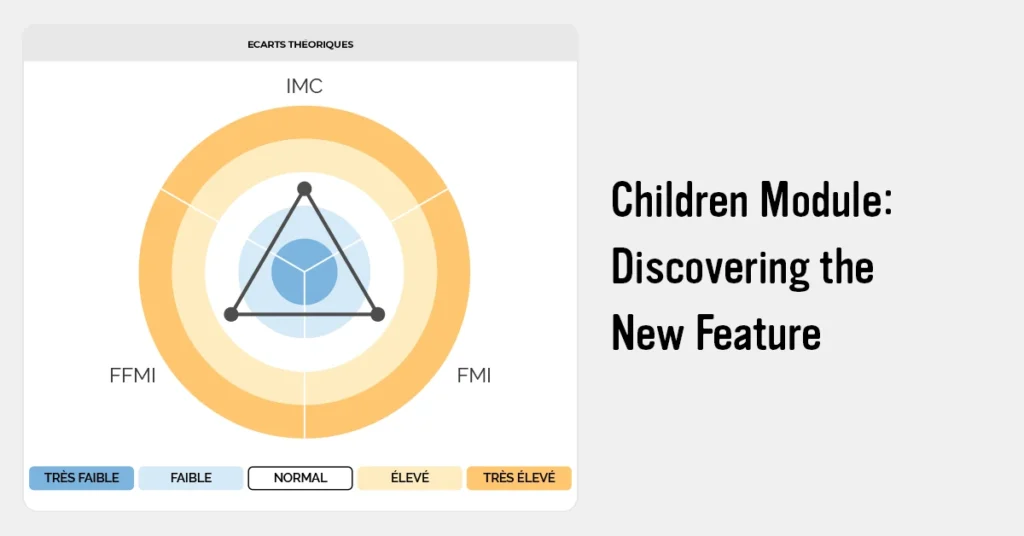
Data interpretation begins with a synthesis of results presented in target form (Fig. 1). A specific color-coding system, distinct from the one used in adult mode, has been implemented. Colors such as red and green were deliberately avoided to limit any risk of stigmatization in the child, particularly at a time when self-image is being constructed and body composition evolves rapidly with growth.
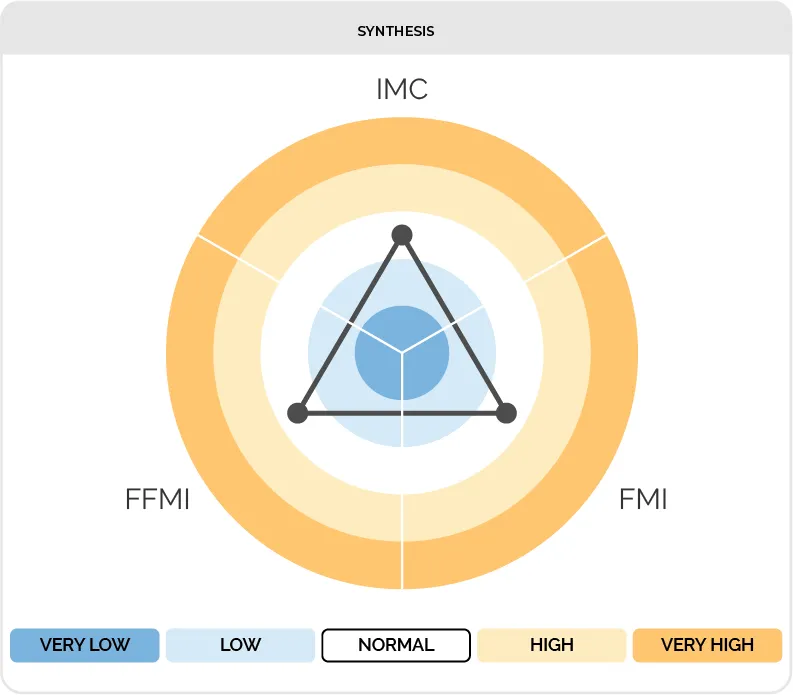
The target establishes the link between the body mass index (BMI) and its two components: the fat mass index (FMI) and the fat-free mass index (FFMI), thus allowing easy identification of the cause of any potential imbalance. Inside the target, in dark blue and light blue, values lower than the expected references for age are indicated. Towards the outside, in light orange and dark orange, values higher than the expected references are indicated. The white zone situated between these two zones corresponds to the reference standard.
In the presented case (Fig. 1), the patient is well-balanced, with a BMI, FMI, and FFMI within normal ranges for age.
Body Composition Indicators
Body composition indicators, determined from raw electrical data as well as anthropometric data, are fat mass (FM) and fat-free mass (FFM), expressed in kilograms and as a percentage of total body weight. The absolute values of FM and FFM are indexed to height to obtain the fat mass index (FMI) and the fat-free mass index (FFMI), and can be compared at the population scale.
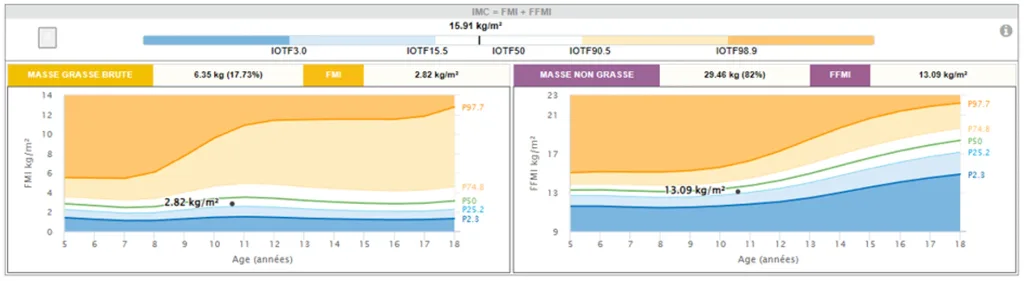
In our case (Fig. 2), the BMI is 15.91 kg/m², located in the reference zone. The fat mass index is 2.82 kg/m² and is situated between the P25.2 and P50 percentiles, also in the reference zone. The lean mass index is 13.09 kg/m² and is also situated between the P25.2 and P50 percentiles, within the normality interval for the population of his age. We can conclude that this patient presents satisfactory values of fat mass and lean mass.
The distribution of body composition is interpreted from references adjusted to age and height. BMI and fat mass do not follow a strictly linear evolution during growth, which makes it difficult to define universal absolute thresholds. Further research remains necessary to refine these limits. The essential point is to position the child on the reference curves according to his age and height, in order to verify whether he is within the normality interval or outside of it, and thus identify any potential tissue deficit or excess.
The principle is the same as in adults: BMI does not provide sufficient information to identify the cause of overweight or thinness. This is even more true in children, where its value, as we will see later, only makes sense when interpreted according to age. The FMI and FFMI indices constitute valuable tools for identifying the cause of a BMI deviation from norms.
Anthropometric Indicators and Growth Curves
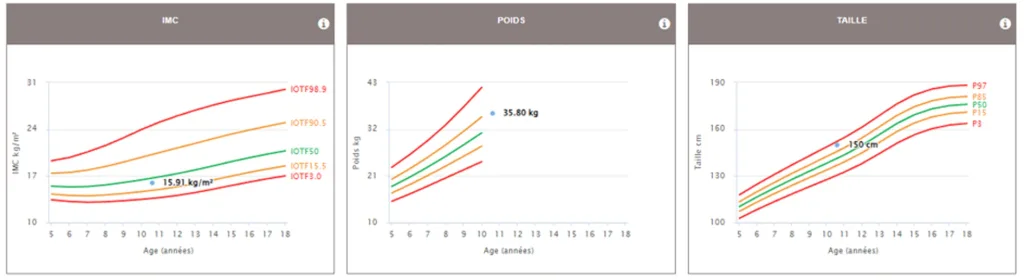
BMI is interpreted using age- and sex-specific thresholds from the International Obesity Task Force (IOTF), expressed as population percentile equivalents or according to WHO references.

In our case (Fig. 3), the BMI is situated between the IOTF 15.5 and IOTF 90.5 percentiles, in the white zone, which corresponds to a BMI between 18.5 and 25 at age 18. The white zone corresponds to normal weight; the light blue zone to grade 1 thinness; the dark blue zone to grades 2 and 3 of thinness; the light orange zone to overweight; and the dark orange zone to obesity.
Children do not have a constant BMI during their growth [1]. During infancy, BMI is high, then it naturally decreases during the toddler and preschool years, when the child grows in height without significant fat mass gain. This phase of relative thinness is completely normal. Around the age of 5 to 7 years, BMI begins to increase again and continues to grow during puberty and adolescence, until reaching adult values around age 18. During this period, knowledge of body composition is particularly useful. The IOTF curves follow this physiological evolution, so their absolute value varies according to age.
A BMI of 15 does not intrinsically indicate thinness at 10 years in the same way as at 18 years. What matters is its position relative to the reference curves for a given age and sex. In this example of a 10-year-old boy, a BMI of 15.91 is situated between the 15th and 50th percentile curves, corresponding to a normal value. The same value would be situated approximately on the 50th percentile curve if the considered age were 7 years. On the height-for-age and weight-for-age growth curves of the presented case (Fig. 4), the boy is situated in the upper percentiles, indicating good statural-weight growth for his age. He presents a tall and athletic profile.
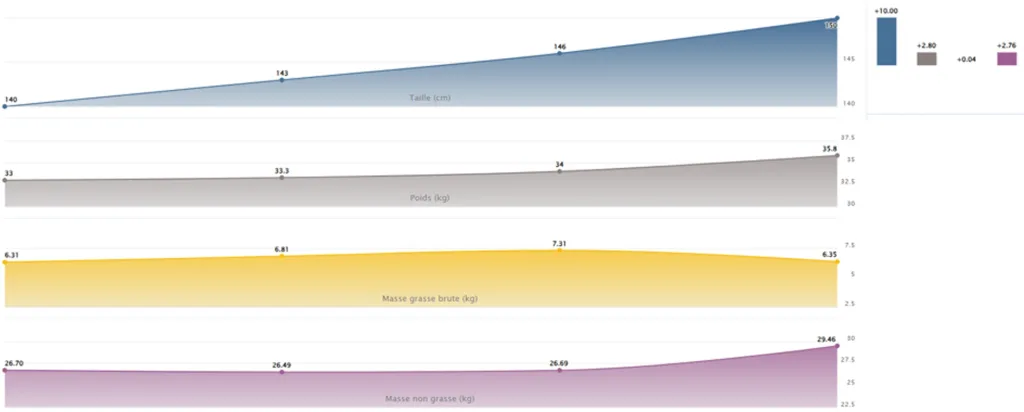
One of the features available in the application is the “History” option, which allows visualization of patient evolution over time. In the presented case (Fig. 5), we observe the statural-weight evolution of the patient over a one-year period, as well as that of his body compartments. During this period, the child grew 10 cm and gained 2.8 kg. Body composition analysis shows that this weight gain consists of 0.04 kg of fat mass and 2.76 kg of fat-free mass.
Raw Electrical Indicators and Phase Angle
On the raw electrical data of our case (phase angle of 4.4° and IR of 0.84), these parameters can be used to follow their evolution over time. It is still difficult to establish fixed thresholds for these indicators.
In children and adolescents, the phase angle evolves progressively with age, reflecting the quantitative and qualitative changes in body composition related to growth and maturation. It generally increases from early childhood until the end of adolescence and is influenced by age, sex, BMI, lean mass, and biological maturity level. During puberty, these variations may be transient due to rapid developmental changes [2,3]. In longitudinal patient monitoring, an increase in phase angle is generally associated with the development of cellular integrity, while a decrease may correspond to a transient modification requiring monitoring or an ongoing pathological process.
Références
- Cole TJ, Lobstein T. Extended international (IOTF) body mass index cut-offs for thinness, overweight and obesity. Pediatr Obes. 2012 Aug;7(4):284-94. doi: 10.1111/j.2047-6310.2012.00064.x. Epub 2012 Jun 19. PMID: 22715120
- Bosy-Westphal A, Danielzik S, Dörhöfer RP, Later W, Wiese S, Müller MJ. Phase angle from bioelectrical impedance analysis: Population reference values by age, sex, and body mass index. JPEN Journal of Parenteral and Enteral Nutrition. 2006;30(4):309-316.
- Mattiello R, Amaral MA, Mundstock E, Ziegelmann PK. Reference values for the phase angle of the electrical bioimpedance: systematic review and meta-analysis involving more than 250,000 subjects. Clinical Nutrition. 2020;39(5):1411-1417. doi:10.1016/j.clnu.2019.07.004